קורס – DSP-L1 – 002 ומבוא לראיה ממוחשבת
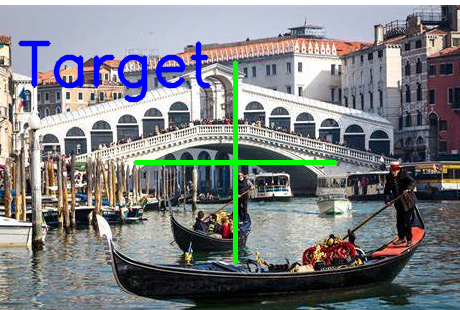
טעינת תמונה – כתיבה סימון על התמונה:
|
1 2 3 4 5 6 7 8 9 10 11 12 13 14 15 16 17 18 19 20 21 22 23 24 25 26 27 28 29 30 31 32 33 34 35 36 37 38 39 40 41 42 43 44 45 46 47 48 49 50 51 52 53 54 55 56 57 58 59 60 61 62 63 64 65 66 67 68 69 70 71 |
# Python program to explain cv2.imwrite() method # importing cv2 import cv2 # importing os module import os # Filename img = cv2.imread("venice_1.jpg") h,w,c = img.shape print('width: ', w) print('height: ', h) print('channel:', c) x=int(w/2) y=int(h/2) p1 = (x-100, y) p2 = (x+100, y) # Green color in BGR color = (0, 255, 0) # Line thickness of 9 px thickness = 3 img = cv2.line(img, p1, p2, color, thickness) x=int(w/2) y=int(h/2) p1 = (x, y-100) p2 = (x, y+100) img = cv2.line(img, p1, p2, color, thickness) # font font = cv2.FONT_HERSHEY_SIMPLEX # Using cv2.putText() method fontScale =2 # Blue color in BGR color = (255, 0, 0) # Line thickness of 2 px thickness =3 p1 = (20, 80) p2 = (20, 80) msg='Target' image = cv2.putText(img, msg, p1, font, fontScale, color, thickness, cv2.LINE_AA) # Using cv2.imwrite() method # Saving the image filename="orange3.jpg" cv2.imwrite(filename, img) cv2.imshow(" test",img) print('Successfully saved') cv2.waitKey(0) |
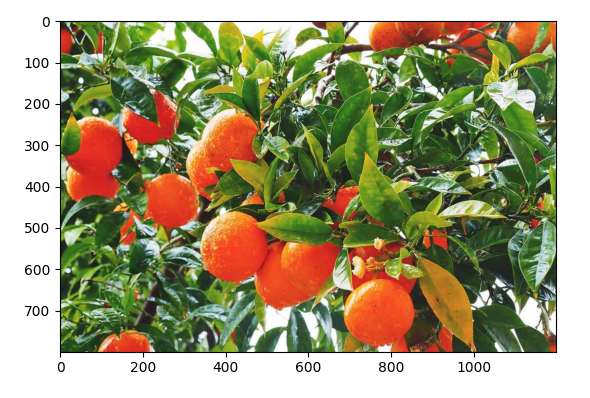
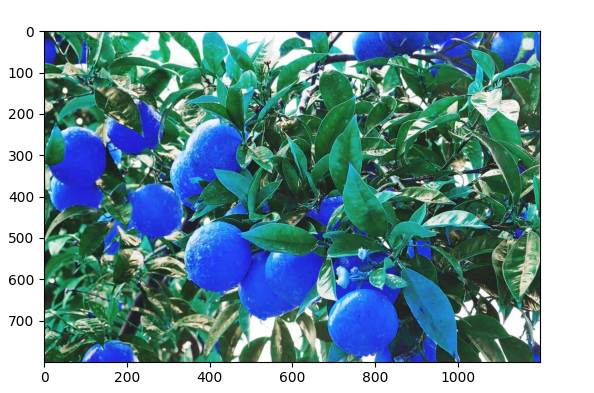
הלעת תמונה ושימוש ב PLOT
|
1 2 3 4 5 6 7 8 9 10 11 12 13 14 15 16 17 18 19 20 21 22 23 24 25 26 27 28 29 30 31 32 33 34 35 36 |
# Python code to read image import time import cv2 import matplotlib.pyplot as plt # To read image from disk, we use # cv2.imread function, in below method, img = cv2.imread("orange2.jpg") # Converting BGR color to RGB color format RGB_img = cv2.cvtColor(img, cv2.COLOR_BGR2RGB) # Creating GUI window to display an image on screen # first Parameter is windows title (should be in string format) # Second Parameter is image array #cv2.imshow("image", img) plt.legend("BGR") plt.imshow(img) plt.show(block=True) plt.interactive(False) plt.imshow(RGB_img) plt.show(block=True) plt.interactive(False) # To hold the window on screen, we use cv2.waitKey method # Once it detected the close input, it will release the control # To the next line # First Parameter is for holding screen for specified milliseconds # It should be positive integer. If 0 pass an parameter, then it will # hold the screen until user close it. cv2.waitKey(0) # It is for removing/deleting created GUI window from screen # and memory cv2.destroyAllWindows() |
קליטת תמונת וידאו בסיסית ממצלמת וידאו
|
1 2 3 4 5 6 7 8 9 10 11 12 13 14 15 16 17 18 19 20 21 22 23 24 25 26 27 |
import cv2 # Open the webcam cap = cv2.VideoCapture(0) # Check if the webcam was opened successfully if not cap.isOpened(): print("Error: Could not open webcam") else: # Read and display frames from the webcam while True: # Read a frame from the webcam ret, frame = cap.read() if not ret: break # Display the frame cv2.imshow("Webcam", frame) # Check if the "q" key was pressed key = cv2.waitKey(1) if key == ord("q"): break # Release the webcam and destroy all windows cap.release() cv2.destroyAllWindows() |
מציאת אוביקטים בתמונה
|
1 2 3 4 5 6 7 8 9 10 11 12 13 14 15 16 17 18 19 20 21 22 23 24 25 26 27 28 29 30 31 32 33 34 35 36 37 38 39 40 41 42 43 44 45 46 47 48 49 50 51 52 53 54 55 56 57 58 59 60 61 62 63 64 65 66 67 68 69 70 71 72 73 74 75 76 77 78 79 80 81 82 83 84 85 86 87 88 89 90 91 92 93 94 95 96 97 98 99 100 101 102 103 104 105 106 107 108 109 110 111 112 113 |
import cv2 import numpy as np import matplotlib.pyplot as plt # Read the image qfile image = cv2.imread('D:/temp/Image_shape_1.jpg') # convert img to grey img_grey = cv2.cvtColor(image, cv2.COLOR_BGR2GRAY) # set a thresh thresh = 230 # get threshold image ret, thresh_img = cv2.threshold(img_grey, thresh, 255, cv2.THRESH_BINARY) # Check if the image was successfully read if image is None: print("Error: Could not read the image file.") else: # reading the input image # define colors to plot the histograms colors = ('b', 'g', 'r') # compute and plot the image histograms for i, color in enumerate(colors): hist = cv2.calcHist([image], [i], None, [256], [0, 256]) plt.plot(hist, color=color) plt.title('Image Histogram GFG') #plt.show() # Calculate the histogram of the grayscale image histogram = cv2.calcHist([img_grey], [0], None, [256], [0, 250]) # Plot the histogram #plt.plot(histogram) #plt.show() cv2.imshow('Image3', img_grey) cv2.imshow('Image2', thresh_img) # find contours contours, hierarchy = cv2.findContours(thresh_img, cv2.RETR_TREE, cv2.CHAIN_APPROX_SIMPLE) # create an empty image for contours img_contours = np.zeros(image.shape) # draw the contours on the empty image cv2.drawContours(img_contours, contours, -1, (0, 255, 0), 3) # Going through every contours found in the image. # Detecting contours in image. # using a findContours() function contours, hierarchy = cv2.findContours(thresh_img, cv2.RETR_TREE, cv2.CHAIN_APPROX_SIMPLE) print( hierarchy) i = 0 img = image # list for storing names of shapes for contour in contours: # here we are ignoring first counter because # findcontour function detects whole image as shape if i == 0: i = 1 continue # cv2.approxPloyDP() function to approximate the shape approx = cv2.approxPolyDP( contour, 0.01 * cv2.arcLength(contour, True), True) # using drawContours() function cv2.drawContours(img, [contour], 0, (0, 0, 255), 5) # finding center point of shape M = cv2.moments(contour) if M['m00'] != 0.0: x = int(M['m10'] / M['m00']) y = int(M['m01'] / M['m00']) # putting shape name at center of each shape if len(approx) == 3: cv2.putText(img, 'Triangle', (x, y), cv2.FONT_HERSHEY_SIMPLEX, 0.6, (255, 255, 255), 2) elif len(approx) == 4: cv2.putText(img, 'Quadrilateral', (x, y), cv2.FONT_HERSHEY_SIMPLEX, 0.6, (255, 255, 255), 2) elif len(approx) == 5: cv2.putText(img, 'Pentagon', (x, y), cv2.FONT_HERSHEY_SIMPLEX, 0.6, (255, 255, 255), 2) elif len(approx) == 6: cv2.putText(img, 'Hexagon', (x, y), cv2.FONT_HERSHEY_SIMPLEX, 0.6, (255, 255, 255), 2) else: cv2.putText(img, 'circle', (x, y), cv2.FONT_HERSHEY_SIMPLEX, 0.6, (255, 255, 255), 2) # displaying the image after drawing contours cv2.imshow('shapes', img) # Wait for user input key = cv2.waitKey(0) cv2.imshow('Image4', img2) if key == ord('q'): # Quit the program if 'q' is pressed cv2.destroyAllWindows() dst = cv2.calcHist(img, [0], None, [256], [0, 256]) plt.hist(image.ravel(), 256, [0, 256]) plt.title('Histogram for gray scale image') plt.show() |