בינה מאלכותית RB14-22 : טרנספורמים וקטגוריה
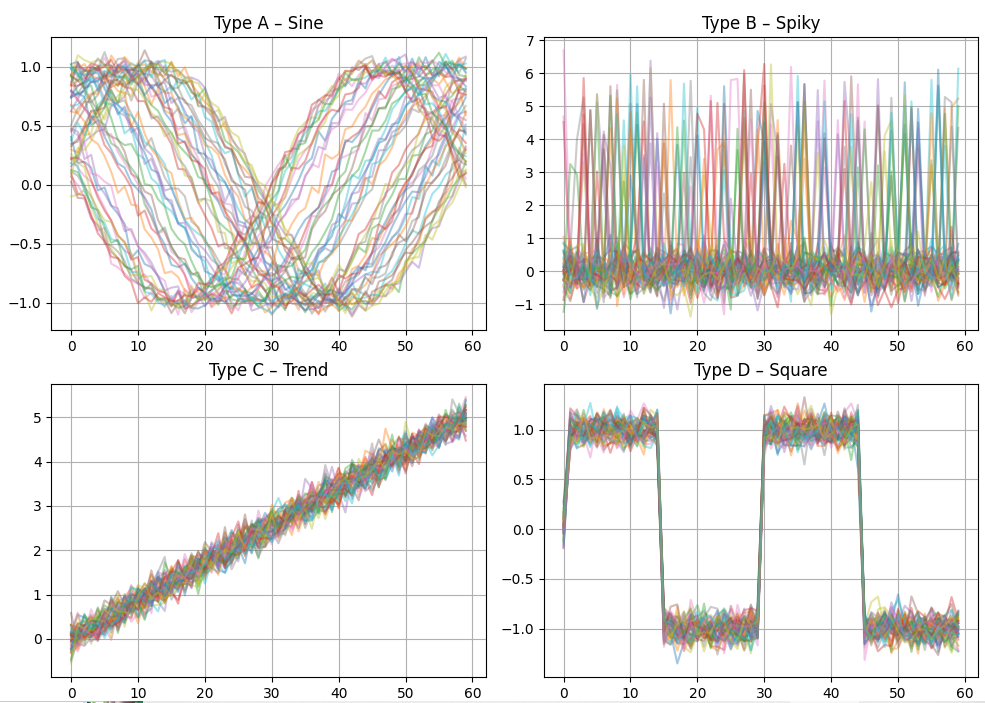
It generates four groups of time sequences, prints statistical summaries, and visualizes them on graphs
|
1 2 3 4 5 6 7 8 9 10 11 12 13 14 15 16 17 18 19 20 21 22 23 24 25 26 27 28 29 30 31 32 33 34 35 36 37 38 39 40 41 42 43 44 45 46 47 48 49 50 51 52 53 54 55 56 57 58 59 60 61 62 63 64 65 66 67 68 69 70 71 72 73 74 75 76 77 78 79 80 81 82 83 84 85 86 87 88 89 90 91 92 93 94 95 96 97 98 99 100 101 102 103 104 105 106 107 108 109 110 111 112 113 114 115 116 |
# -*- coding: utf-8 -*- """ Sequence Pattern Generator & Visualizer --------------------------------------- This program creates 4 groups of 1-D sequences, each with 50 examples: Type A – smooth sine waves Type B – random noise with spikes Type C – upward linear trend Type D – square wave pattern It then: 1. Prints statistical summaries (mean, std, min, max) for each group. 2. Plots all sequences for visual comparison. """ import numpy as np import matplotlib.pyplot as plt # ========================================== # 1. Basic configuration # ========================================== np.random.seed(0) # for reproducibility SEQ_LEN = 60 # number of time steps per sequence N_PER_TYPE = 50 # number of samples per group t = np.linspace(0, 2*np.pi, SEQ_LEN) # time vector # Arrays to hold data A, B, C, D = [], [], [], [] # ========================================== # 2. Generate 50 sequences for each pattern # ========================================== for _ in range(N_PER_TYPE): # ---- Type A: Smooth sine waves ---- # Periodic motion with small noise seqA = np.sin(t + np.random.uniform(0, np.pi)) + np.random.normal(0, 0.05, SEQ_LEN) A.append(seqA) # ---- Type B: Spiky random noise ---- # Mostly random values with a few large spikes seqB = np.random.normal(0, 0.4, SEQ_LEN) spikes = np.random.choice(SEQ_LEN, 4, replace=False) seqB[spikes] += np.random.uniform(3, 6, size=4) B.append(seqB) # ---- Type C: Rising trend ---- # Gradual increase from 0 to 5 with small noise seqC = np.linspace(0, 5, SEQ_LEN) + np.random.normal(0, 0.2, SEQ_LEN) C.append(seqC) # ---- Type D: Square wave pattern ---- # Alternating high/low states with small noise seqD = np.sign(np.sin(2*t)) + np.random.normal(0, 0.1, SEQ_LEN) D.append(seqD) # Convert lists to NumPy arrays for easy math A, B, C, D = np.array(A), np.array(B), np.array(C), np.array(D) # ========================================== # 3. Print statistical summaries # ========================================== def print_summary(name, data): """Print simple statistics for each group.""" print(f"{name}:") print(f" Mean: {np.mean(data):6.3f}") print(f" Std: {np.std(data):6.3f}") print(f" Min: {np.min(data):6.3f}") print(f" Max: {np.max(data):6.3f}") print("-" * 30) print_summary("Type A (Sine)", A) print_summary("Type B (Spiky)", B) print_summary("Type C (Trend)", C) print_summary("Type D (Square)", D) # ========================================== # 4. Plot sequences of each group # ========================================== plt.figure(figsize=(10,8)) # ---- Type A plot ---- plt.subplot(2,2,1) plt.title("Type A – Sine (Smooth Periodic)") for seq in A: plt.plot(seq, alpha=0.4) plt.xlabel("Timestep") plt.ylabel("Value") plt.grid(True) # ---- Type B plot ---- plt.subplot(2,2,2) plt.title("Type B – Spiky / Noisy") for seq in B: plt.plot(seq, alpha=0.4) plt.xlabel("Timestep") plt.grid(True) # ---- Type C plot ---- plt.subplot(2,2,3) plt.title("Type C – Rising Trend") for seq in C: plt.plot(seq, alpha=0.4) plt.xlabel("Timestep") plt.grid(True) # ---- Type D plot ---- plt.subplot(2,2,4) plt.title("Type D – Square Wave Pattern") for seq in D: plt.plot(seq, alpha=0.4) plt.xlabel("Timestep") plt.grid(True) plt.tight_layout() plt.show() |